Figure 1.

Download original image
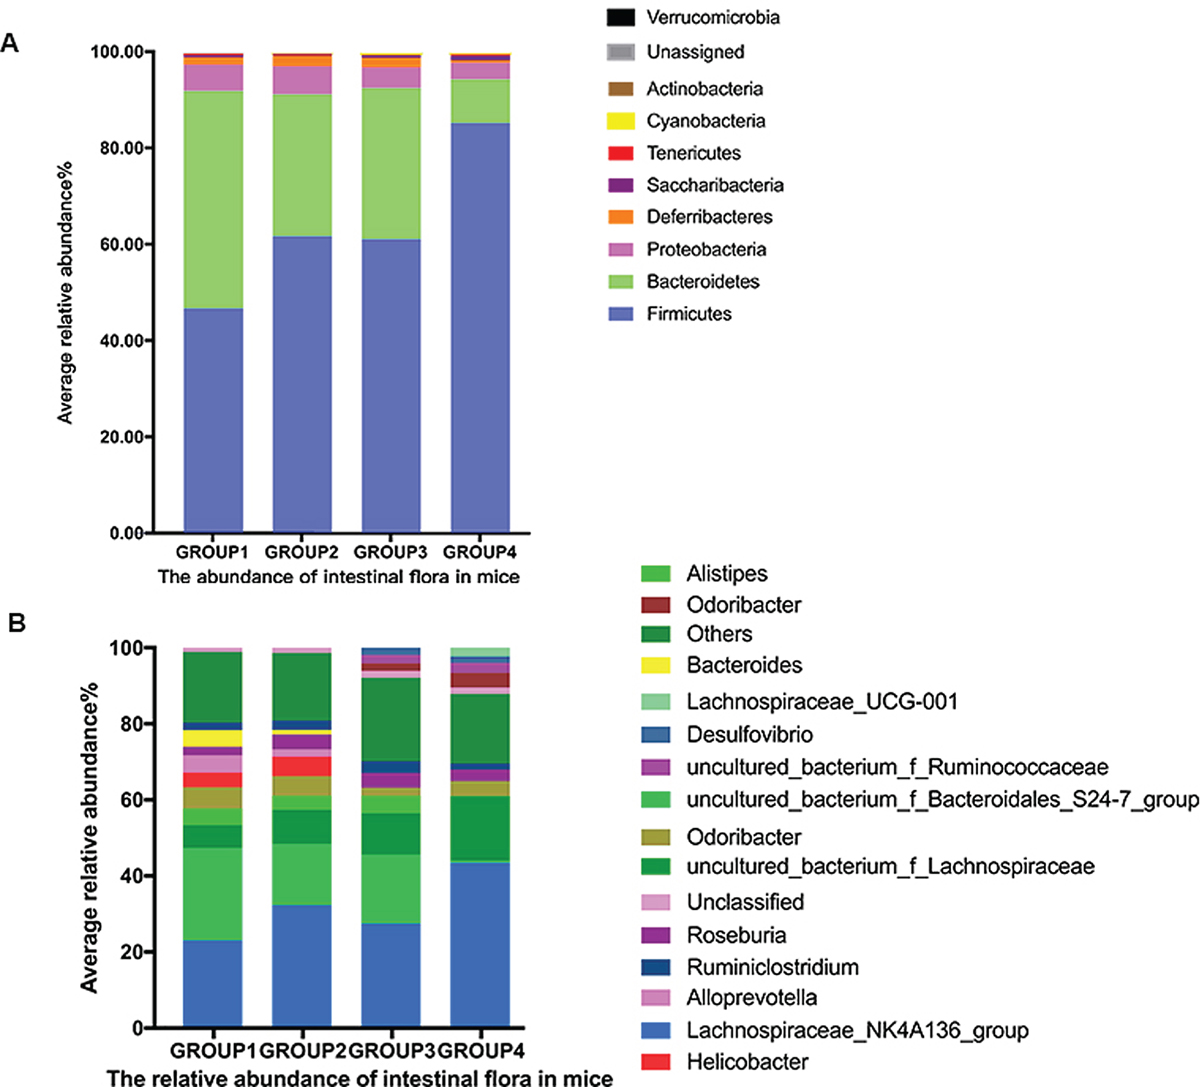
Analysis of intestinal flora structure. (A) The abundance of intestinal flora in mice; (B) the relative abundance of intestinal flora in mice; (GROUP 1: Blank group of experimental group 1; GROUP 2: Drug group of experimental group 1; GROUP 3: Blank group of experimental group 2; GROUP 4: Drug group of experimental group 2).
Current usage metrics show cumulative count of Article Views (full-text article views including HTML views, PDF and ePub downloads, according to the available data) and Abstracts Views on Vision4Press platform.
Data correspond to usage on the plateform after 2015. The current usage metrics is available 48-96 hours after online publication and is updated daily on week days.
Initial download of the metrics may take a while.